


 Italiano
Maintenance KPIs are indicators selected to assess maintenance objectives and decide where to act, using comparable data. MTBF, MTTR and availability describe different aspects; none alone measures the full quality of maintenance.
Which KPIs to choose
Section titled “Which KPIs to choose”| Question | Indicator to read | Unit or comparison basis |
|---|---|---|
| How long does equipment operate between failures? | MTBF | Operating hours. |
| How long does a repair take? | MTTR | Repair hours, with declared boundaries. |
| What share of the period is the function available? | Availability | Percentage of reference time. |
| How much work remains and how is it performed? | Backlog, preventive/corrective work and deadlines | Available capacity and shares on consistent bases. |
The sections below provide formulas, examples and calculation conditions. The maintenance plan defines activities and criteria against which recorded work can be compared.
From question to measurement
Section titled “From question to measurement”A KPI is selected because it matters to an objective. It needs a formula, unit, population, period, data source and owner. UNI EN 15341:2022 (opens in a new tab), listed as current, provides a maintenance indicator framework addressing economic, technical and organizational influences. It does not require every measure to appear on a dashboard.
UNI EN 17007:2018 (opens in a new tab), with its 2018 corrigendum, connects maintenance processes and associated indicators. Start with the decision: reducing recurring failures requires different information from reducing spare-parts waiting time.
For repairable equipment, an estimate is MTBF = total observed operating hours / number of failures. Downtime is excluded from the numerator. NIST (opens in a new tab) describes this estimate under a constant failure-rate model: it is not a promise about the next failure date.
An imaginary pump accumulates 900 operating hours and three failures: estimated MTBF is 300 hours. With no observed failures, the ratio cannot provide a finite estimate: report the period and exposure rather than “infinite reliability”. Do not indiscriminately pool equipment with different uses and operating conditions.
In this article MTTR = sum of repair durations / number of completed repairs. Three repairs lasting two, four and six hours give an MTTR of four hours. Declare which events define a repair and how work still open is handled.
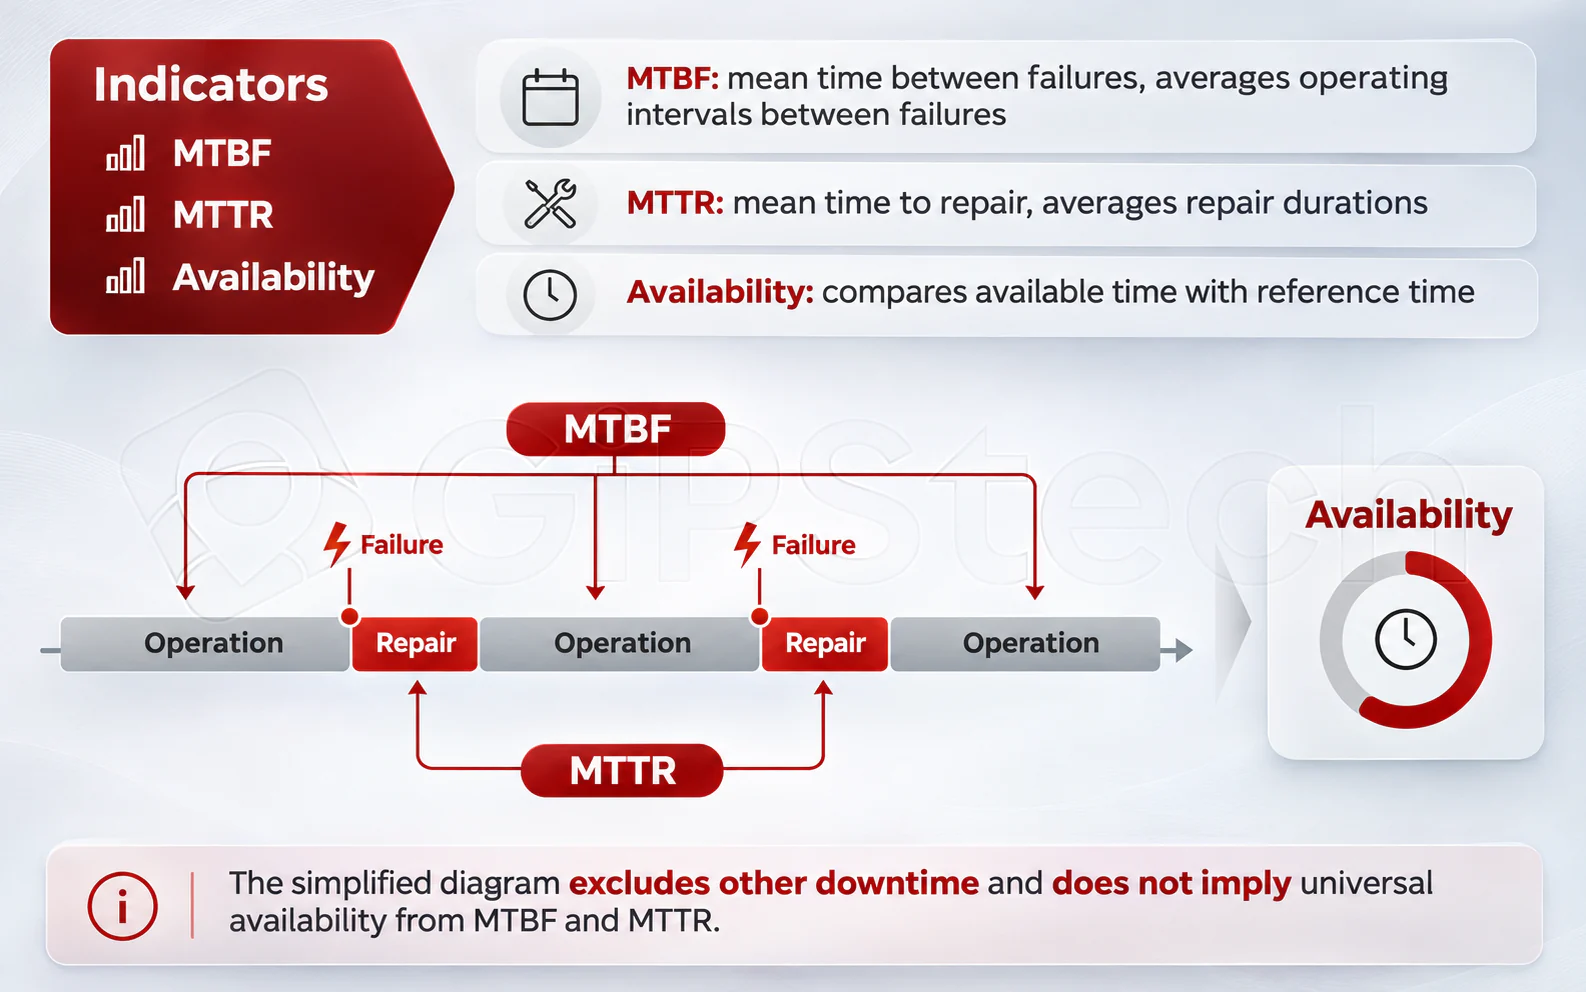
The acronym alone is insufficient: different references use it for repair or restoration. ISO/TR 12489 (opens in a new tab) makes this ambiguity explicit. Spare-parts waiting, travel and authorization may be excluded from active repair yet contribute to real downtime. Recording them separately helps identify causes rather than attributing all elapsed time to the technician’s repair work.
Availability and calculation conditions
Section titled “Availability and calculation conditions”Observed availability is available time / reference time × 100. Specify when equipment is required and which downtime is included. In a simplified example with 900 available hours and twelve hours of repair only, it is 900 / 912 × 100, approximately 98.7%.
The relationship MTBF / (MTBF + MTTR) applies to a consistent model alternating operation and repair, with compatible averages and units. It does not automatically reproduce operational availability when waiting, preventive maintenance or other downtime is omitted. Do not mix hours, days and different calendars.
Other useful indicators
Section titled “Other useful indicators”| Indicator | Definition to declare |
|---|---|
| Backlog | Approved work still to perform; in weeks it can be estimated remaining hours / genuinely available weekly capacity. |
| Preventive and corrective work | Shares based on hours, costs or intervention counts, keeping the chosen basis explicit. |
| Deadline compliance | Activities completed by the deadline / assessable activities; show open overdue work separately. |
In manufacturing, OEE combines production availability, performance and quality. A simple reading uses operating time / planned production time, actual output compared with theoretical output in that operating time, and good units / produced units; multiply the three fractions. Maintenance alone does not determine speed or scrap. ISO 22400-2 (opens in a new tab) provides a framework for manufacturing indicators and time models.
Read the data before the dashboard
Section titled “Read the data before the dashboard”Check failure classifications, missing timestamps, duplicates and open work. With few events an average is unstable; show sample size and distribution alongside it. An apparent improvement may come from a changed scope rather than a changed process.
These formulas are educational; they do not certify that every report implements them identically. The reserved report and dashboard documentation requires sign-in and describes the operational context. For contractual targets see SLAs; GiPStech’s overview (opens in a new tab) provides application context.